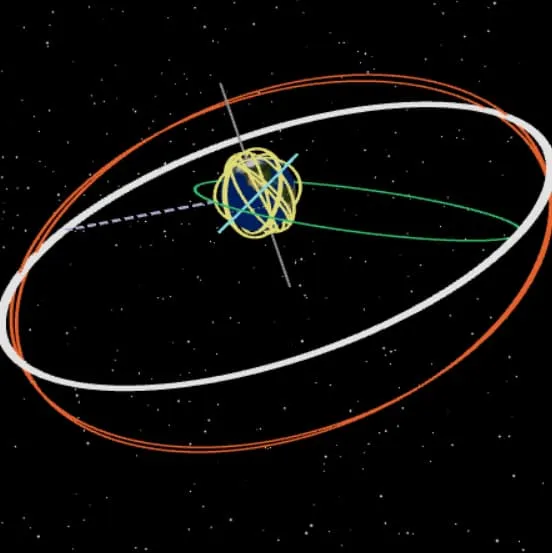
My favorite course I took at KTH during my study abroad had to be Information Visualization. The class was structured in two sections. We began the period by working on a small project to learn the D3 library and prepare us for the second section: the main project.
We were given ultimate freedom for our project. As long as it used some data and visualized it in some way, it was all fair game. Our group found a common interest in space, and decided to focus on satellites as an important modern industry and one with fairly accessible data.
Our dataset was a combination of data from the Union of Concerned Scientists, CelesTrak’s SATCAT, and CelesTrak’s TLE data. The website itself was built with React and used D3 and ThreeJS for the visualization.
You can see the final product here. On the same site you can visit the Project Overview page to read more about the development process or the Team Members page to read more about each person’s individual contributions.
